Research Projects
Autumn Clustering Analysis
Spring Clustering Analysis
Snowsquall Climatology
Deep Learning Clustering
WRF Extreme Precipitation
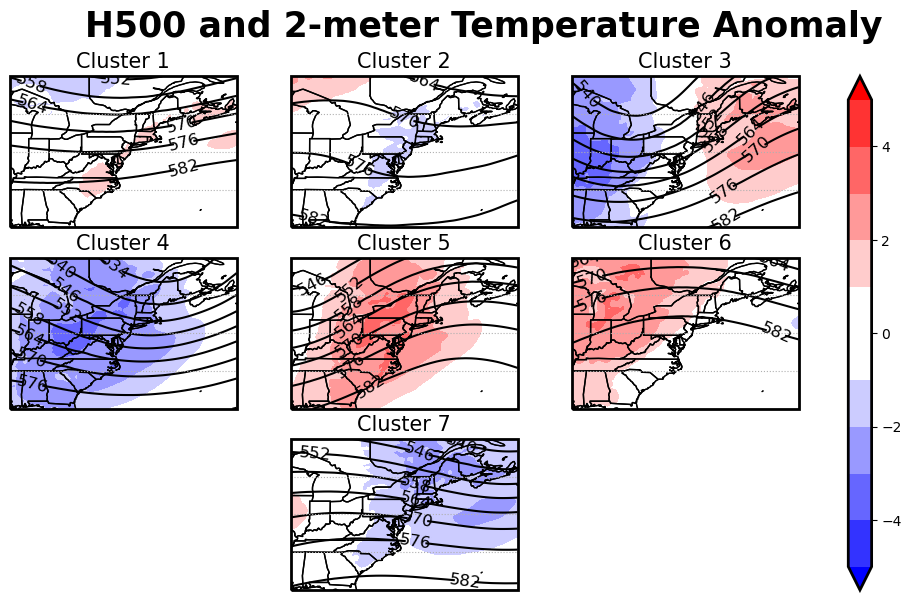
Clustering Analysis of Autumn Weather Regimes in the Northeast U.S.

- A k-means clustering method is applied to daily ERA5 500-hPa heights, sea level pressure, and 850-hPa winds, 1979-2008, to identify characteristic Weather Types (WTs) for Sep-Nov for the Northeast U.S. The resulting WTs are analyzed in terms of structure, frequency of occurrence, typical progressions, precipitation and temperature characteristics, and relation to teleconnections. The WTs are used to make a daily circulation-based distinction between early and late autumn and consider shifts in seasonality. Seven WTs are identified for the autumn season, representing a range of trough and ridge patterns. The largest average values of precipitation and greatest likelihood of extremes occurs in the Midwestern Trough and Atlantic Ridge patterns. The greatest likelihood of extreme temperatures occurs in the Northeast Ridge. Some WTs are strongly associated with the phase of the North Atlantic Oscillation and Pacific North America pattern, with frequency of occurrence for several WTs changing by more than a factor of two. The two most common progressions between the WTs are one most frequent in September, Mid-Atlantic Trough to Northeast Ridge to Mid-Atlantic Trough, and one most frequent in mid-October to November, Midwestern Trough to Northeast Trough to Midwestern Trough. This seasonality allows for a daily WT-based distinction between early and late season. A preliminary trend analysis indicates an increase in early season WTs later in the season and a decrease in late season WTs earlier in the season; that is, a shift toward a longer period of warm season patterns and a shorter, delayed period of cold season patterns.
- Funded by NASA NESSF Grant NNX15AN91H S03, NOAA NA20OAR4310424, and NSF AGS-1623912
- Supervisor: Dr. Mathew Barlow
- Analyzed seasonality of the circulation patterns, confirming previous observations that summer is lasting longer in the year and winter starting later.
- Read the Paper!
- View the code!
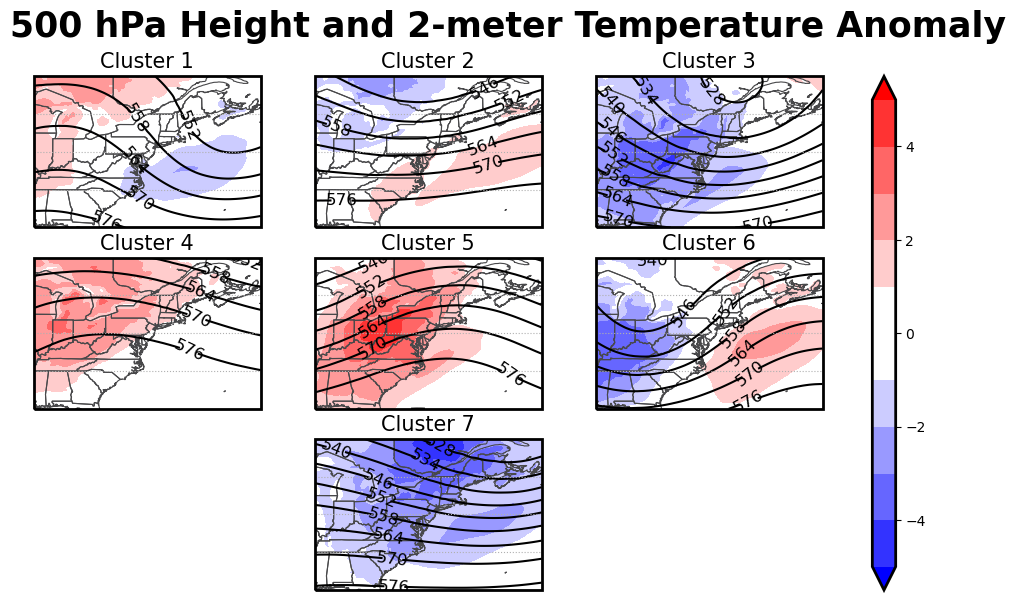
Spring Season Circulation Evolution and Relation to Extreme Events in the Northeast U.S.

- Characteristic Weather Types (WTs) for the spring season, Mar – May, in the Northeast U.S. are identified using k-means clustering of ERA5 500-hPa height, MSLP, and 850-hPa u and v winds. The resulting WTs are analyzed for their seasonal, monthly, and daily frequency, their seasonal evolution, and relation to extreme temperature and precipitation events. Seven WTs are identified for the spring season, each representing a distinct trough and ridge pattern. The WTs show seasonality, with three WTs likely to occur in the beginning of the season (Early Season) and three likely to occur at the end of the season (Late Season). Using daily frequencies of the Early and Late Season WTs, the middle of Spring is identified and changes in its timing are identified through splitting the time series into two equal halves. The middle of the spring season is found to come 12-15 days earlier, significant at the 95% level, and occurs 2-4 days longer. Combined with more Late Season WTs occurring in April, this shows a shift toward warmer, more summer-like circulation patterns occurring earlier in the season. Typical extreme precipitation and heat wave patterns for the Northeast U.S. were both captured by the daily circulation WTs. Extreme precipitation occurred during all except for one WT, while heat waves occurred in all except for Early Season WTs. Droughts can occur during any WT, with the least amount of drought days occurring in April.
- Funded by NASA NESSF Grant NNX15AN91H S03, NOAA NA20OAR4310424, and NSF AGS-1623912
- Supervisor: Dr. Mathew Barlow
- Enhanced understanding of extreme Precipitation, Heat wave, and Drought events during the spring season in the Northeast U.S. by investigating their relation to the underlying seasonal circulation patterns.
- Analyzed seasonality in the circulation patterns over the study period. These results are in line with observations that the summer season is beginning earlier into the year (on average 7-12 days) and the winter season is getting shorter.
- Lead author on paper in preparation.
Understanding Winter Season Onset and Withdrawal Timing in the Northeast U.S. Using Circulation Patterns and Deep Learning

- Currently in progress!
- Supervisor: Dr. Mathew Barlow
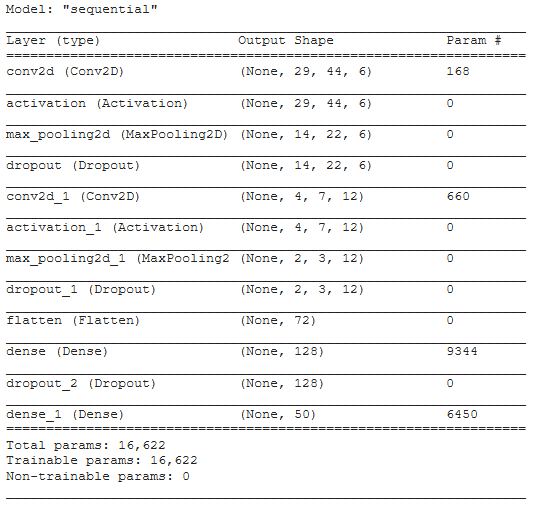
- Developed a Siamese Neural Network deep learning model to perform image matching on small datasets.
- Matched winter season dates to typical spring and fall circulation patterns to determine typical onset and withdrawal timing of winter in terms of spring and fall circulation patterns.
- Currently analyzing the seasonality of the circulation patterns over the course of the three seasons (fall, winter, and spring) to understand the typical onset and withdrawal timing of the seasons and analyze them for changes over the study period.
- Lead author on paper in development.
Analyzing the Role of Integrated Vapor Transport and Diabatic Heating on Extreme Precipitation Events in the Northeast U.S.
- Two Northeast US extreme precipitation patterns from Agel et al. 2017 (patterns C3 and C6) are analyzed using the WRF-ARW model with and without diabatic heating, to investigate the role of diabatic heating in the extreme nature of the precipitation in these cases. These two patterns exhibit high values of moisture and moisture transport occurring in conjunction with a warm conveyor belt, in the context of an extratropical storm. The WRF-ARW model was run using NCEP GFS-FNL data for 20 events (10 from C3 and 10 from C6) from 2000-2008 on both a 36 km and 9 km nested grid from 30N to 50 N and -90W to -60W. Four runs were performed on each event, two runs with no changes made to the model and two runs with all latent heating parameters set to zero. For both control and modified runs, there were two sets of experiments: one initialized 2 days prior to the event, and another initialized 1 day prior to the event. This allowed us to test both the influences of diabatic heating on the extreme precipitation and the formation of the event itself. In both patterns, removing the diabatic heating resulted in a 40-50% decrease in overall precipitation for the event and shifted the axis of heaviest precipitation south and west. Integrated water Vapor Transport (IVT) values were 25% less, frontogenesis was shifted further south, and vertical velocities were 50% less compared to the no change runs. The higher resolution grid produced more accurate results due, while the two day and one day prior runs showed only modest differences in simulating the extreme events.
- Funded by NOAA NA20OAR4310424, and NSF AGS-1623912
- Supervisor: Dr. Mathew Barlow
- Modelled 20 extreme-precipitation events in the Northeast U.S. using the WRF-ARW that were associated with Warm Conveyor Belts and Moisture Transport.
- Configured WRF-ARW to run with and without diabatic heating terms using a two-way nested model of resolutions 27km and 3km.
- Coded python scripts to plot and analyze the output, determining that diabatic heating played a significant role in Integrated Vapor Transport, its absence causing weakening of extreme precipitation events, with some events not producing enough precipitation to cross the threshold of extreme precipitation.
- Lead author on paper in development.
A Climatology of Snow Squalls in Southern New England 1994 - 2018

- Snow squalls are sudden snow events, lasting less than one hour, characterized by low visibility and gusty winds, which can result in notable societal impacts. This analysis develops a climatology of non-lake effect snow squall events in Southern New England for 1994 – 2018 and investigates the synoptic environment and mesoscale factors conducive to their formation. National Weather Service surface observations were used to identify events; sea-level pressure maps, composite radar charts, and a cell tracking algorithm were used to determine their organization and movement; and ERA5 hourly reanalysis data were used to analyze the associated synoptic and mesoscale features, as well as convective and symmetric instability. One hundred events were identified and categorized into four distinct types of behavior based on the direction of movement of the associated radar echoes, which is closely linked to characteristic synoptic structures and mesoscale factors. The four types are Classic (squall movement from the northwest, 72 events), Atlantic (from the southwest, 15 events), Northern (from the north, 9 events), and Special (varying, 4 events). All types have a 500-hPa trough over the Northeast but differ in the structure of the trough and its relation to lower-level flow, which accounts for the differences in movement of the squalls. The snow events occur in shallow, convective squall lines and the ingredients for convection were present in all cases. Both upright and symmetric instability are typically present, all cases had at least one lower-tropospheric layer with cyclonic differential vorticity advection, and many cases were also associated with frontogenesis.
- Supervisor: Dr. Frank Colby
- Coded FORTRAN and Python scripts to download METAR station data and determine dates, times, and locations of snow squall events based on given observations. Created a dataset of NEXRAD files for the dates and times of squalls based on proximity to radar sites KBOX and KENX.
- Reconfigured existing Python script (TINT) for cell tracking to work with the NEXRAD dataset of snow squall events and output the average direction of cell movement as both a .csv file and plotted on a radial plot of cardinal directions.
- Co-author on paper in review at Monthly Weather Review.